API Monitoring Tools are a necessity these days and if you are looking for the best programs for that, you are at the right place. But before going in-depth about these programs. First, we have to understand the basics. So let us start with API.
What is API?
First of all, the full form of the term API is Application Programming Interface. In general, it means a clearly defined method of communication in between two separate software or programs. The program can be made for any operating system, that does not matter and it can also be used in web-based systems, operating systems, database systems, computer hardware, or software library.
For better understanding, let us check out an easy example – Uber. People are used to using this platform to travel in even smaller cities nowadays. Whenever you open the application, you can see a map of your surrounding and choose your location, where you want to travel. But if you look closely, you will be able to spot the Google logo on the corner. That means the map you can see in the Uber app is provided by Google. Not only Uber, any app that shows a map, all around the world, other than countries like China, take advantage of Google Maps.
The reason behind using Google Maps is, the business does not need to make their whole new map system, which will obviously cost a lot of money and time. Also, whenever a new place is added, they have to update it on their map to stay relevant. We are talking about all these because this whole system of showing Google Maps on other applications is done via an API provided by Google. If somehow the API breaks, the app, for our example Uber will not be able to show the map, thus face a huge loss.
Cost of API Downtime?
From the last example, you can easily see that a single minute of downtime of Google Maps API can bring a massive amount of loss for Uber worldwide. Also, we only talked about a simple scenario, there are millions of platforms and software available which are relying on other company’s APIs. In the article ‘The Cost of Downtime’ Andrew Lerner wrote ‘Based on industry surveys, the number we typically cite is $5,600 p/minute, which extrapolates to well over $300K p/hour.’
What are API Monitoring Tools?
As we see the amount of loss we can accept from API downtime, now you can easily understand why your company or business needs API monitoring tools. As in the real-world scenario, anything can go wrong without a warning. So other than the money itself, you also lose trust from your customers. An API monitoring tool can detect and play its cards if anything goes wrong extremely fast even before the customer notices anything. So keeping everything in mind, let us talk about the 12 best tools you can use to safeguard your APIs.
13 Best API Monitoring Tools for Your Business
1. ManageEngine Applications Manager
ManageEngine Applications Manager enables admins to monitor the availability and response time of REST API endpoints, check & verify responses, and look into the mobile and web applications that use your API. Often, the operations in applications involve multiple API calls – bonded and linked as a sequence. Applications Manager also enables monitoring of a sequence of APIs in a single session.
On top of REST API monitoring, it also offers comprehensive infrastructure monitoring,application performance monitoring, synthetic monitoring and real user monitoring.This tool also offers a robust fault management feature with intelligent alerts and predictive analytics that complements its monitoring capabilities perfectly. It helps IT operations and DevOps teams stay on top of resource outages and performance problems by isolating the root cause of issues quickly.
Cost: Applications Manager’s Professional Edition starts at $395/year for monitoring up to 10 websites/APIs. It also has free and enterprise plans to choose from.
2. Uptrends
Kicking off the list we have Uptrends. Not only for APIs, but it also provides monitoring for websites, servers and more. So you can use it as an all-in-one solution. More than 25 thousand businesses are using their facilities, including companies like Microsoft, Vimeo and Volkswagen.
It uses different browsers in different operating systems to check out the health of your APIs and provide detailed statistics. Other than that, whenever it checks a problem, it takes a screenshot and sends it to you right away, so you can take much-needed steps.
Cost: The Starter package of Uptrends costs $15.47 per month which comes to 1 operator, pre-selected checkpoints, real user monitoring, public status page, SMS and email alerts etc.
3. Dotcom-Monitor
Next up is Dotcom-Monitor which provides HTTP/S, Web API SOAP/REST, SSL certification check, OAuth 2.0-based web APIs for availability, performance, and proper responses etc. Their agents will verify if there are any errors, and if so it checks again with the device’s filter. You can assign multiple alert groups to easily understand the reason behind an issue.
The reports they provide are available in CSV, PDF, and TXT formats. These reports include useful metrics, such as response times, downtime, and average performance by location. Worldwide they have 30 monitoring locations scattered around the countries to provide the best performance anywhere at any given time.
Cost: Their Web Services package costs $19.95 per month and comes with a 1-5 minute check frequency, HTTP/S, web server, response validation, 3-year data retention and more.
4. Checkly
Then we have Checkly, which is a great solution for those who are looking for detailed information in well-managed graphs or charts. JavaScript community is the main source of clients for the platform. Companies like humio, 1Password, Vercel are some of their happy clients.
This platform allows users to set up a detailed alerting system in combination with Opsgenie, Pagerduty, or Slack. Another interesting feature of this tool is REST API. This allows you to automate your checks, for example, with Terraform. For their interesting and well-organized user interface, for newcomers, this is one of the best platforms.
Cost: The best part of Checkly is it has a free for lifetime solution, with which you can get 50k API check runs and 5k browser check runs per month, with 5 users and basic features. For Enterprise plans, you can directly contact their sales team.
5. Amazon CloudWatch
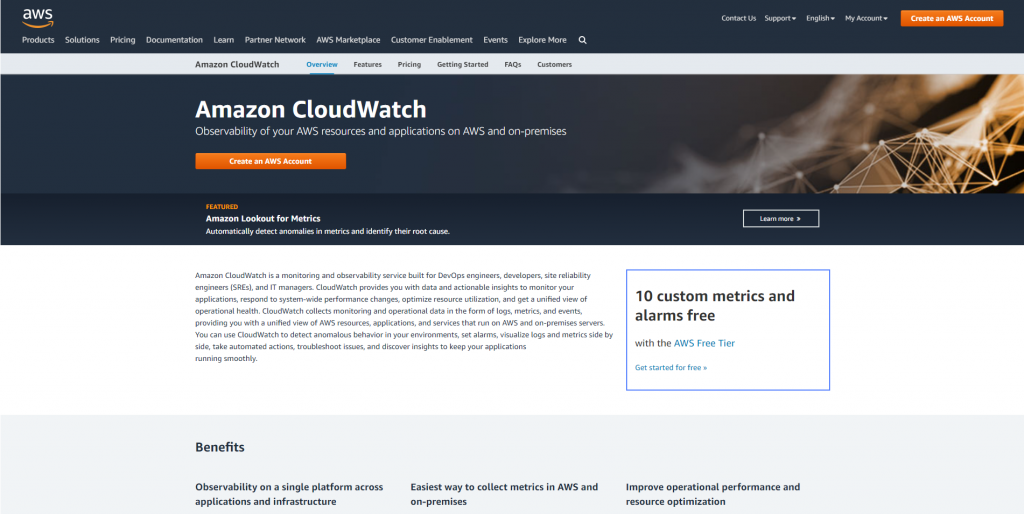
We all know about Amazon for their online shopping site and Alexa, but they have many other businesses and one of those is API monitoring tools. Also, if you are already using AWS, Amazon CloudWatch should be your first preference. Other than application monitoring, it also comes with infrastructure monitoring, system-wide visibility, resource optimization and others.
The best part is you do not have to set up anything, the AWS service automatically generates important logs and shares them with CloudWatch. So with AWS and CloudWatch, you will be able to monitor your uptime, performance, resource usage, network bandwidth, disk/CPU usage, and so on. If needed you can create custom rules and alarms.
Cost: Another great thing about CloudWatch is it offers both free and paid tires. For free you will get basic monitoring tools at 5.minute frequency, 10 details monitoring metrics and a million API requests etc. Their paid plans come with various options, so you can choose those depending on your need and budget.
6. Sematext
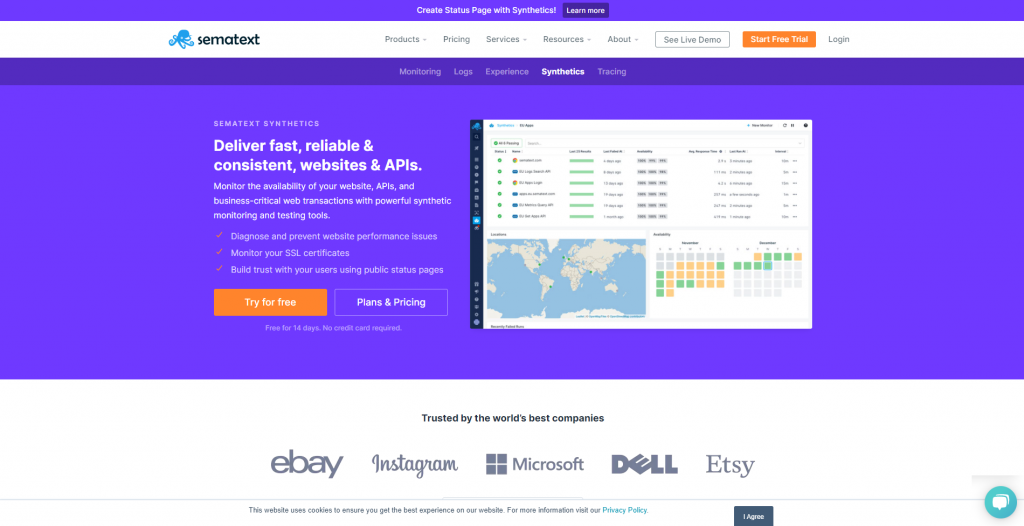
Well-known among DevOps teams, Sematext is the next solution on the list. It comes with many solutions and API monitoring is a part of their synthetic monitoring service. To remove the chances of false positives, you can customize the notification system depending on multiple conditions.
With the simple and powerful HTTP monitoring, it provides comprehensive browser monitoring, with which you will be able to collect web performance metrics based on scripted user interactions with the website. That means you can run things like logging in, registration, add to cart options every minute, to check if those are working properly.
Cost: The basic features are provided for free. Then the standard cost is $0.007 per container host per hour. Their Pro plan also comes with a 14-day trial period.
7. Splunk
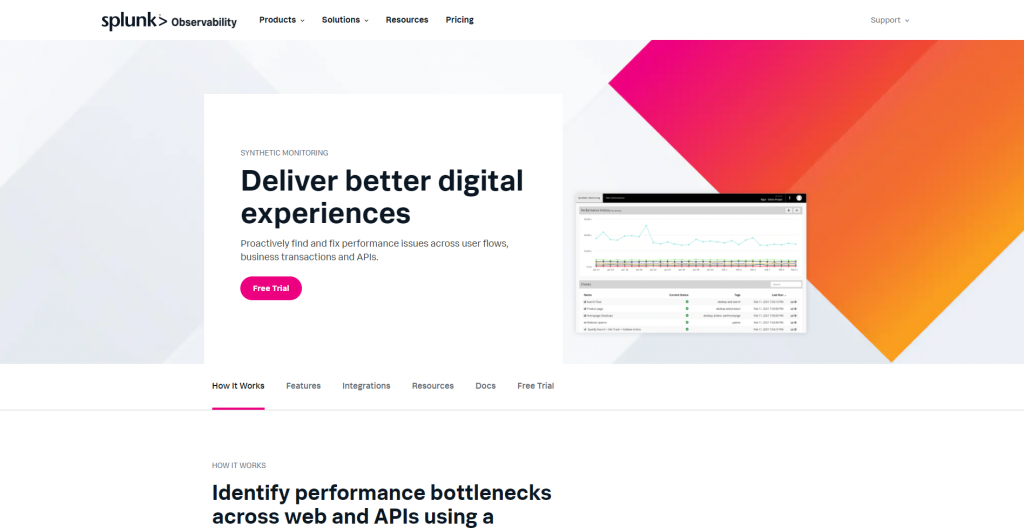
Next up is Splunk, which provides the focus on performance metrics and customer experience. Their user interface is pretty simple and reminds me of the WordPress user interface, which is easy to understand and pick up. The most used feature of Splunk is functional testing, which means testing the entire flow of a transaction.
You will be able to understand endpoint up-time, view SLA performance over time, check alert history and share the dashboard with your team. It will also show you more than 300 optimization recommendations depending on your website and API needs. Finally, Splunk will also benchmark your site against your competition and much more.
Cost: Their Standard plan starts at $95 per host per month and is billed annually. Other than measuring end-to-end user experience with frontend user monitoring with Splunk RUM, important features are present there.
Related Article: 7 Best Board Management Software for Startups to Big Business
8. Assertible
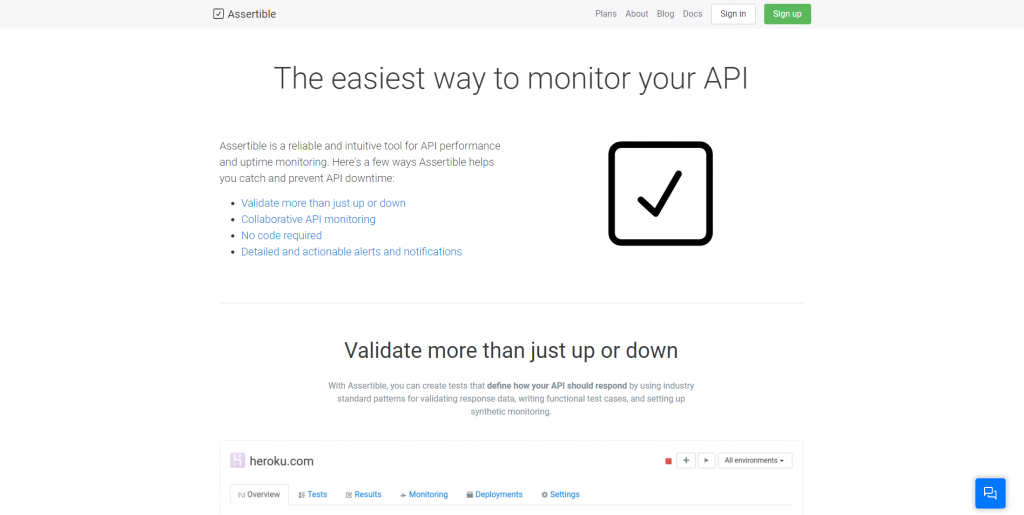
Then we have Assertible and their motto is to create the easiest API monitoring tool and is primarily geared towards Testing and QA teams. So for first-time users and basic needs, it will be a great solution to check out. It can also integrate with GitHub and Slack for better communication and shared knowledge. So anyone in the team can create variables to check if anything is wrong.
At the time of writing the article, companies like Drift, Swap, Grove Technologies, Tapa, MyWheels are using Assertible. You also do not need to write any codes, everything is laid simply. Their robust notification system is built to provide you with all the important details of your test failure so you can respond quickly.
Cost: Their Personal plan is completely free to use which is good for 1-2 people team. If you need more options and need to work with multiple team member, the Standard plan cost $25 per month. You will get the first month free as a trial too.
9. BlazeMeter
Gartner Customers’ Choice for Software Test Automation id BlazeMeter and it is best at end-to-end testing and monitoring of applications. If you need a simple tool without any complications, this is not the tool you should look into. But although it is complex, the feature set is overwhelming for professionals. Once you get your head around it, you will not move to any other tool for sure.
The biggest upside of this tool is integration with Apache Jmeter. Jmeter is the default performance measurement tool for large web applications. As the program is built for developers, their dedicated testing tool Taurus can expose a Domain Specific Language which can be used to write generic tests that can be run against JMeter, Selenium, and other popular open-source tools. Domain-Specific Language or DSL in short is a better version of YAML.
Cost: As the tool is made for the developers and comes with all the features one can ever ask for, BlazeMeter is costly. If you have around 5,000 concurrent users, it will cost $649 per month.
10. AppDynamics
After that, we have AppDynamics which is a part of the well-known brand Cisco. This is one of the oldest solutions out there and also well-received. This is not a single tool, but a suite of tools that will allow you to solve a broad range of performance and monitoring requirements of a modern SaaS team. If you only need the API solution, that is called Microservice IQ. This program will help you to monitor and analyze a microservice cluster of virtually any scale while preserving its history.
Other than that cloud monitoring and DevOps monitoring are also available. It is integrable with IaaS providers such as Amazon AWS, Azure, Pivotal, etc. The most important part of this tool is it can check and report a single cause of failure, among a cluster of micro-services from the code. The whole system comes with various other features which you can check on their website.
Cost: You can get the quotation from their sales team but the good news is it comes with a 15-day trial period.
11. New Relic
A relatively new but robust solution is New Relic which is mostly known for its application performance monitoring tools. As it comes with various price segments, from large companies in the Fortune 500 list to small start-ups, everyone can take advantage of it. They are confident in their deep understanding of DevOps and their intuitive layout of the entire system. Thanks to that, you can easily spot any problem and pinpoint the location.
Other than that, you can set goals and rules for customer experience and check where you need to put more time. I cannot stress more on their beautifully organized dashboard more, so you might want to check it out yourself for better understanding.
Cost: New Relic comes with a Free (Forever) plan, but they also provide plans for Standard, Pro and Enterprise requirements.
12. API Fortress
Up next is API Fortress. It offers ‘continuous API testing and monitoring that unifies functional, integration, and load testing across internal, partner, and third party APIs’. So it works like a Swiss army knife of API monitoring. The program is aimed at both developers and testers with features like Load Testing and Mocking.
To help the developers, it can create a test suite from a given API specification. If you have basic knowledge of Swagger, OpenAPI, or RAML it will be much easy for you to start working with. On the other hand, API mocking allows dev teams to define the interface of the new API as a mock service.
Cost: API Fortress offer plans for both hosted and self-hosted cloud solutions. Their price is based on the number of seats and can be discussed with the sales team.
13. API Science
Last but not least is API Science which comes with a fun concept of testing your APIs with an API. It comes with full-stack monitoring, so it also covers external APIs as well. So if your API is dependant on some other business’ API, API Science will work as the middleman to pinpoint the problem.
Another great feature is it checks your API from multiple locations around the world, so it can detect if you need to change or update anything specifically, for users from far away. To know more you can always browse their site.
Cost: Their Basic plan costs $29 per month which can be used by 3 users and can handle up to 100,000 API Calls. Every tier comes with a month of the free trial also.
Wrapping Up
So, these are all the highly recommend solutions for API monitoring. Let us know if you are using any of these and how are the results. On the other hand, we tried to include tools from different price points and different usage scenarios. Hopefully, with these programs, your APIs will always be working.